|
Ciprofloxacin determination by solid state FT-Raman spectroscopy, |
||
|
Correlation coefficients of the calibration curves were in the range of 0.99-0.996 and 0.991-0.9993 for band intensity and band area measurements, respectively. Detection limits were in the range of 5.5-11 and 3.2-13 % w/w for band intensity and band area measurements, respectively. Precision ranged between 0-11 and 0.4-12 % RSD (n=3) for band intensity and band area measurements, respectively. Results obtained by the proposed method, are equivalent to those acquired through the HPLC reference method, while it does not require dissolution of the pharmaceutical dosage forms. Stepwise multiple linear regression (MLR) was also applied for calibration. The model C = (0.2 ± 1.4) - (33 ± 9) x BI1545 + (57 ± 11) x BI1272, (r = 0.997) gave the best fit. Relative differences between the FT-Raman and the reference method were in the range of (-5.7) - (10.7) %. The proposed FT-Raman method has the advantage of being fast, simple and can be used to replace tedious and time-consuming methods. |
|
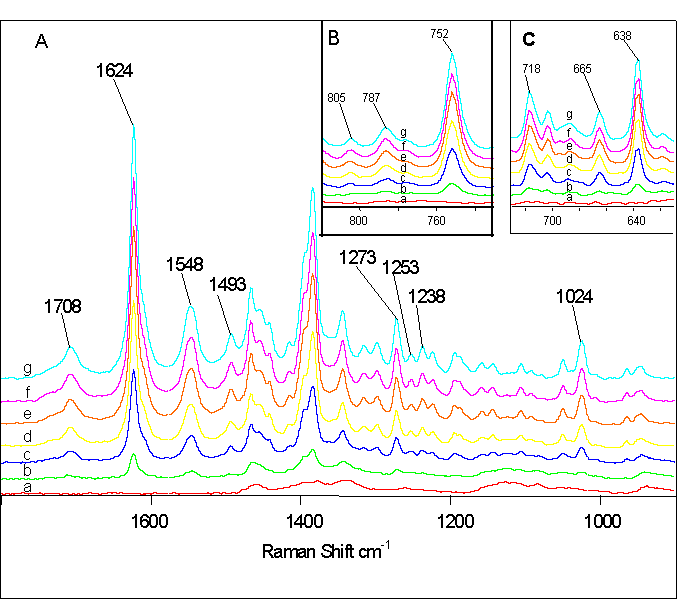
Raman spectra acquired during calibration |
||

|
Questions and comments to author: Dr C.A. Georgiou, cag@aua.gr |