|
Quantitative Acyclovir Determination by FT-Raman Spectroscopy, Dr C.A. Georgiou |
||
|
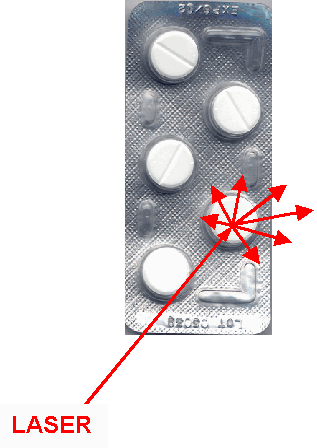
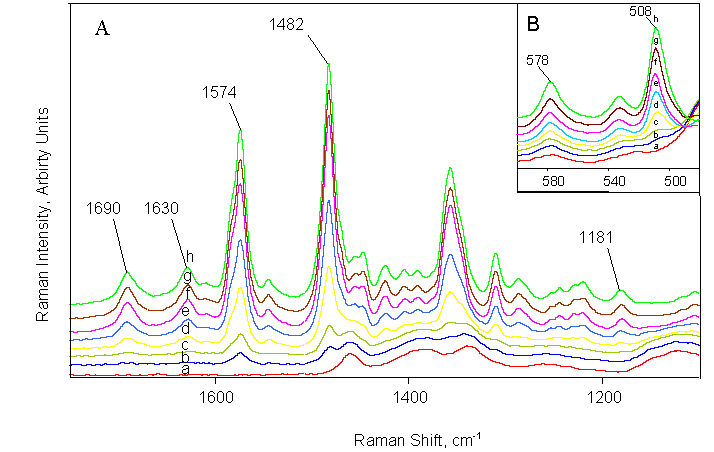
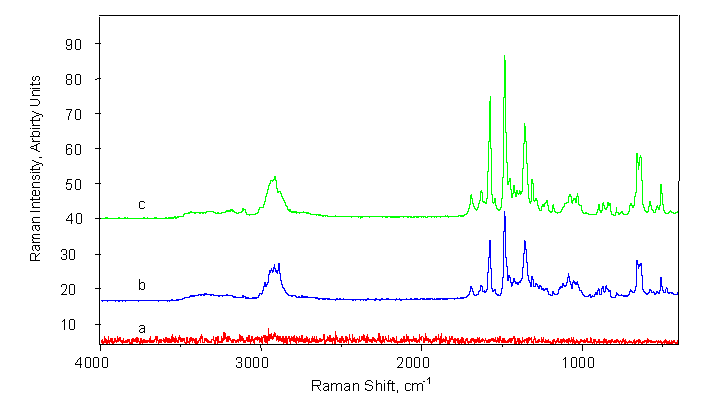
Correlation coefficients of the calibration curves were in the range of 0.997-0.9993 and 0.996-0.9991 for band intensity and band area measurements, respectively. Detection limits were in the range of 2.8-11.1 and 3.7-8.8 % w/w for band intensity and band area measurements, respectively. Precision ranged between 0.7-5.6 and 0.4-4.5 % RSD (n=3) for band intensity and band area measurements, respectively. Results obtained by the proposed method, are equivalent to those acquired through the HPLC reference method. Tablets are analyzed through their package (figure 1), without any interference from the package (figure 3) Stepwise multiple linear regression (MLR) was also applied for calibration. The model C = -(3 ± 1) - (13 ± 4) x BI1690 + (3.5 ± 0.5) x BI1482, (r = 0.997) gave the best fit. Relative differences between the FT-Raman and the reference method were in the range of (-5.4) - (2.0) %. The proposed solid-state FT-Raman method has the advantage of being fast, simple and can be used for the precise and accurate analysis of commercial pharmaceutical solid dosage forms without opening their PVC-blister packages. |

|
Solid pharmaceutical dosage forms are analysed through their PVC-blister package |
||
|
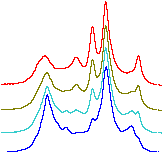
Raman spectra acquired during calibration |
||

|
FT-Raman spectra acquired from |
||

|
Questions and comments to author: Dr C.A. Georgiou, cag@aua.gr |